> ## Documentation Index
> Fetch the complete documentation index at: https://docs.abbyy.com/llms.txt
> Use this file to discover all available pages before exploring further.
# Fuzzy interval visual editor
> Specify fuzzy intervals graphically with the Fuzzy Interval Editor in ABBYY FlexiLayout Studio, adjusting slopes, extreme points, and non-penalized points.
ABBYY FlexiLayout Studio offers a visual editor to make specifying fuzzy intervals easier.
You can open the fuzzy interval editor in one of two ways:
* From the **Properties** dialog box of a **Character String** element: on the **Character String** tab, click the  button.
* From the main menu, select **Tools → Fuzzy Interval Editor…**.
button.
* From the main menu, select **Tools → Fuzzy Interval Editor…**.
 ## Graph axes and coordinates
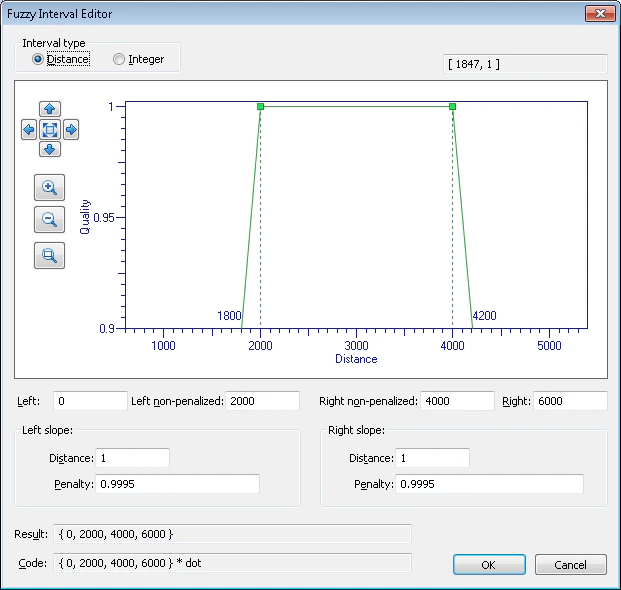
The **Fuzzy Interval Editor** displays a graph representation of the fuzzy interval. The vertical axis measures the quality of the hypothesis, and the horizontal axis measures the linear dimensions or the number of characters. The graph also shows the coordinates where the fuzzy interval borders intersect the horizontal axis.
## Zoom and pan the graph
The **Zoom in** and **Zoom out** buttons change the horizontal and vertical scales synchronously. You can also zoom a selected image area with the **Zoom selected area** button. The
## Graph axes and coordinates
The **Fuzzy Interval Editor** displays a graph representation of the fuzzy interval. The vertical axis measures the quality of the hypothesis, and the horizontal axis measures the linear dimensions or the number of characters. The graph also shows the coordinates where the fuzzy interval borders intersect the horizontal axis.
## Zoom and pan the graph
The **Zoom in** and **Zoom out** buttons change the horizontal and vertical scales synchronously. You can also zoom a selected image area with the **Zoom selected area** button. The 


 buttons move the area in the corresponding direction. To fit the interval, click
  .
## Specify the interval
The fields under the graph contain the numerical values of the interval. You can specify the interval either by editing the graph with your mouse or by entering the numerical values in the corresponding fields.
The visual fuzzy interval editor operates in two modes:
* **Distance** – Fuzzy intervals for units of measurement, which may be fractional. Select **Distance** under **Interval type**.
* **Integer** – Fuzzy intervals for positive integers, such as string length in characters. Select **Integer** under **Interval type**.
If you open the fuzzy interval editor from the **Properties** dialog box of a **Character String** element, one of the two modes is automatically selected depending on the field from which you called the editor.
### Edit the graph
You can change the interval by moving the green markers to the right or to the left with your mouse. You can also change the angle of the slopes. Some restrictions apply. For example, you cannot move the left marker to the right of the right marker. The corresponding numerical values appear in the fields under the graph.
### Change the numerical values directly
The fields correspond to the representation of the fuzzy interval in the program:
| Field | Description |
| -------------------------------- | ------------------------------------------------------------------------------------------------------------------------------------------ |
| **Left** | The left extreme point of the interval. |
| **Left non-penalized** | The left non-penalized point. |
| **Right** | The right extreme point of the interval. |
| **Right non-penalized** | The right non-penalized point. |
| **Left slope** / **Right slope** | Set the slope of the graph's sides, which represents the penalty coefficient for deviating by a **Distance** from the non-penalized point. |
Changing a slope moves the corresponding extreme point without changing the non-penalized point, and changing an extreme point or a non-penalized point changes the corresponding slope. When you edit any field, the graph and the values of the dependent fields update accordingly.
## Save the results
If the fuzzy interval editor was called from the **Properties** dialog box of a **Character String** element, clicking **OK** automatically inserts the fuzzy interval into the corresponding field of the dialog box.
If the fuzzy interval editor was called from the **Tools** menu, you can copy the fuzzy interval from the **Result** field or from the **Code** field. The **Code** field lets you paste the code onto the **Advanced** tab, for example, when using a fuzzy interval as an argument of the **FuzzyQuality** function.
For more information, see [Search for elements with Nearest and FuzzyQuality](/flexi-capture/fls/tips-tricks/date9).
.
## Specify the interval
The fields under the graph contain the numerical values of the interval. You can specify the interval either by editing the graph with your mouse or by entering the numerical values in the corresponding fields.
The visual fuzzy interval editor operates in two modes:
* **Distance** – Fuzzy intervals for units of measurement, which may be fractional. Select **Distance** under **Interval type**.
* **Integer** – Fuzzy intervals for positive integers, such as string length in characters. Select **Integer** under **Interval type**.
If you open the fuzzy interval editor from the **Properties** dialog box of a **Character String** element, one of the two modes is automatically selected depending on the field from which you called the editor.
### Edit the graph
You can change the interval by moving the green markers to the right or to the left with your mouse. You can also change the angle of the slopes. Some restrictions apply. For example, you cannot move the left marker to the right of the right marker. The corresponding numerical values appear in the fields under the graph.
### Change the numerical values directly
The fields correspond to the representation of the fuzzy interval in the program:
| Field | Description |
| -------------------------------- | ------------------------------------------------------------------------------------------------------------------------------------------ |
| **Left** | The left extreme point of the interval. |
| **Left non-penalized** | The left non-penalized point. |
| **Right** | The right extreme point of the interval. |
| **Right non-penalized** | The right non-penalized point. |
| **Left slope** / **Right slope** | Set the slope of the graph's sides, which represents the penalty coefficient for deviating by a **Distance** from the non-penalized point. |
Changing a slope moves the corresponding extreme point without changing the non-penalized point, and changing an extreme point or a non-penalized point changes the corresponding slope. When you edit any field, the graph and the values of the dependent fields update accordingly.
## Save the results
If the fuzzy interval editor was called from the **Properties** dialog box of a **Character String** element, clicking **OK** automatically inserts the fuzzy interval into the corresponding field of the dialog box.
If the fuzzy interval editor was called from the **Tools** menu, you can copy the fuzzy interval from the **Result** field or from the **Code** field. The **Code** field lets you paste the code onto the **Advanced** tab, for example, when using a fuzzy interval as an argument of the **FuzzyQuality** function.
For more information, see [Search for elements with Nearest and FuzzyQuality](/flexi-capture/fls/tips-tricks/date9).