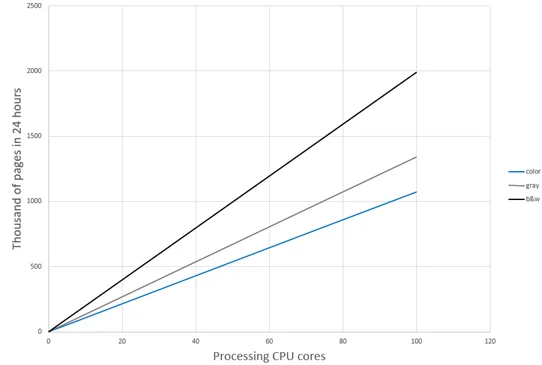
These tests measured how System performance depends on the number of processing CPU cores, for images scanned in three different color modes.

Results

Chart plotting thousands of pages processed in 24 hours against the number of processing CPU cores at the ABBYY bench for three color modes, where all lines rise linearly but black-and-white scales highest to about 2,000 thousand pages at 100 cores, gray sits in the middle, and color is lowest.

Testing setup

These results were measured at the ABBYY bench. For the hardware of each machine role, see Specifications for the ABBYY bench tests.