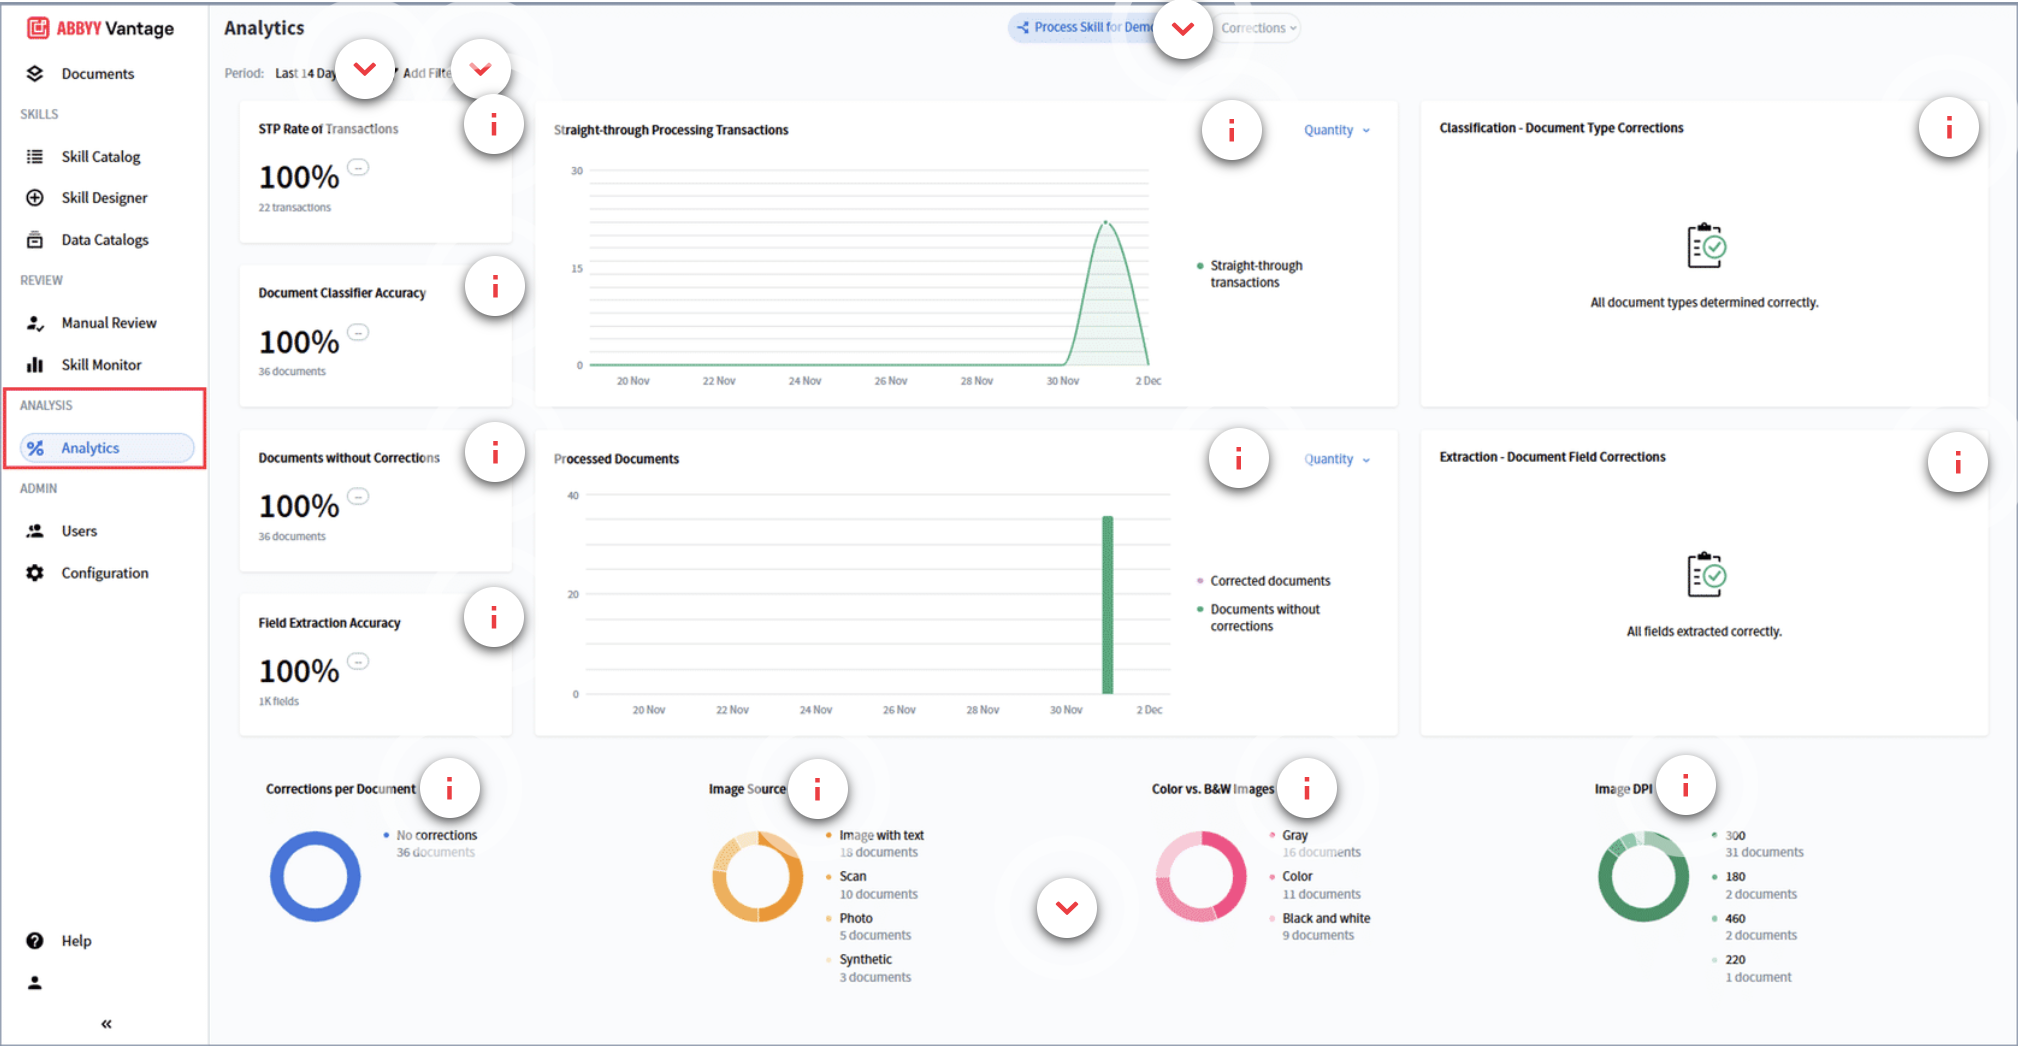
With the Analytics dashboard in Vantage 3.0, performance insights are now far easier to access, interpret, and act upon. Instead of relying solely on API calls or CSV exports, users can view key processing information directly in the interface, presented through clear summaries, graphs, and charts. The system retrieves detailed transaction data from the Analytics Reporting Warehouse and makes it available within minutes of transaction completion, significantly reducing the effort previously required to extract and analyze results. This Vantage Analytics dashboard provides insight into quality assurance, auditing, and operational oversight. It enables teams to ensure the system is reliable, efficient, and operating at peak accuracy, with visual insights into when and where improvements may be needed.  The Analytics dashboard provides analytics and performance metrics to help you track the accuracy, quality, and efficiency of automated document classification and data extraction processes over a specified time period.  The Analytics dashboard focuses specifically on Process skills that include a Manual Review stage, providing visual insights into extraction and classification accuracy, review activity, and overall processing behavior. This makes it easier to conduct retrospective analysis of human-in-the-loop processes and supports the evaluation of all relevant IDP workflows across the platform. Analytics Dashboard

Key Functions

Performance Monitoring

  • STP Rate of Transactions (Straight-Through Processing). Measures automation success without human intervention. 
  • Processed Documents. Visual representation of the number and percentage of processed documents over time. 

Accuracy Metrics

  • Document Classifier Accuracy. How well the system identifies the correct document type. 
  • Field Extraction Accuracy. How accurately data is extracted from the documents. 
  • Documents without Corrections. Indicates the percentage of documents that needed no manual correction. 

Error Analysis 

  • Classification and extraction correction stats (all fields and types were correct in this case). 
  • Visual breakdowns of correction patterns, image source types, color profiles, and DPI levels. 

Operational Insights 

  • Helps stakeholders identify whether the system is functioning with high accuracy. 
  • Provides clues for optimization if STP is low or corrections are high.