As a system administrator, you are tasked with monitoring ABBYY Vantage at all times, managing it, discovering any errors that may occur during document processing, as well as the causes of such errors. You can monitoring ABBYY Vantage by using:
  • Vantage log files
  • The built-in Skill Monitor service, which collects statistics for existing Vantage skills and provides detailed information regarding completed and ongoing transactions. This service also lets you get transaction event information required by technical support.
  • Third-party services which allow you to monitor internal Vantage processes, monitor specific workflows, analyze collected data to further fine-tune and optimize document processing, and collect and analyze logs.
When contacting technical support, in addition to information about errors, you can also provide the version of the product and its components by doing the following:
  1. Click Help on the left pane, then About, and select Version details.
  2. Copy the details.

How to Access Diagnostics Logs

The log files created while processing documents in Vantage are stored locally on the machines used for the product installation. Logs are stored as follows: the Fluent Bit agent running on all Kubernetes nodes collects container logs and sends them to the Fluentd aggregator service. By default, all logs are stored as archive files on a persistent volume and can be accessed using NFS. Optionally, the administrator can also send the logs to the Elasticsearch cluster. Kubernetes logging architecture showing Fluent Bit agents collecting logs from Docker containers, sending to Fluentd aggregator, which outputs to Elasticsearch and Persistent Volume storage To access diagnostics logs:
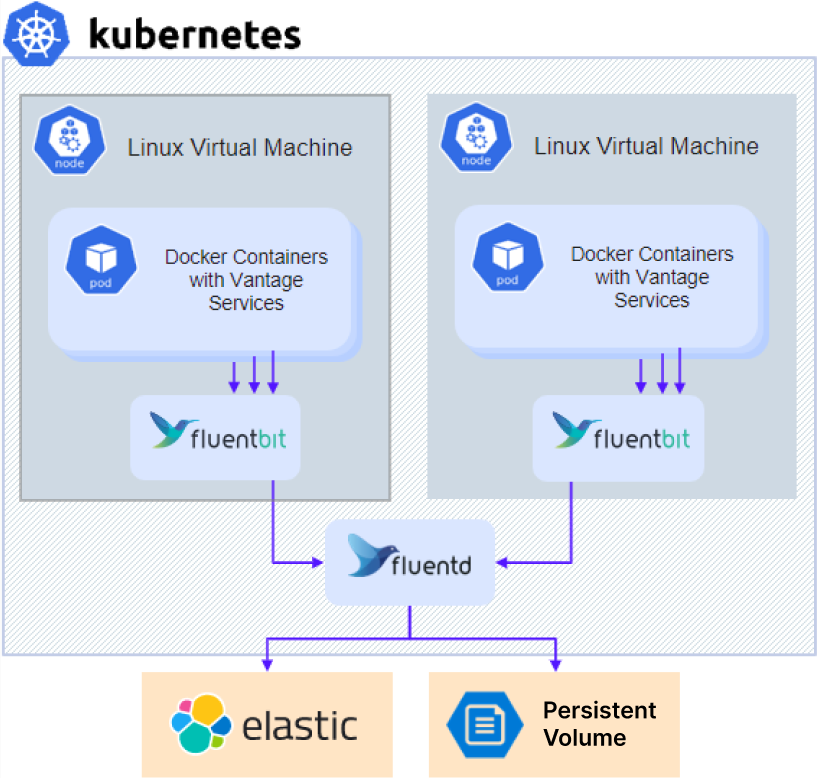
  1. If you are using an external NFS server or other external storage, skip directly to step 3.
  2. For installation with an in-cluster NFS server (default for Without high availability configuration), get the IP address of the NFS server:
kubectl -n nfs get po -lapp.kubernetes.io/name=nfs-kernel-server -o jsonpath='{ .items[*].status.hostIP }'
  1. Access the share:
    • For NFS:
      • Linux: mount –t nfs <nfs server ip>:/ /opt/mount
      • Windows: Install ClientForNFS, open Explorer, and go to \\<nfs server ip>
    • For other types of external storage: Contact your system administrator for access instructions.
  2. Navigate to the \\<nfs server ip>\<sharename>\<env>\abbyy-monitoring\fluentd-pvc directory.

Providing Logs to Technical Support

To provide ABBYY customer support with Vantage logs:
  1. Navigate to the logs folder. Logs are stored in subfolders that have the same names as the namespaces of the Kubernetes cluster. Vantage logs are located in the abbyy-vantage folder.
  2. Copy the files related to the time period when the problem occurred. The logs are compressed as gzip files with names in the Y-M-DD-H format (e.g., 2022-12-09-0800.log.gz).
  3. Send the files to ABBYY technical support.

Elasticsearch and Kibana

Elasticsearch and Kibana are tools for searching, analyzing, and visualizing logs. Elasticsearch and Kibana are not installed together with ABBYY Vantage and have to be installed and set up separately. This can be done regardless of whether the product is installed or not. You can use any existing installation.
The sample setup procedure below has been simplified and is provided only as an example.
To install Elasticsearch and Kibana:
  1. Clone the repository:
git clone https://github.com/elastic/cloud-on-k8s.git
cd cloud-on-k8s
git checkout 2.5
cd deploy/eck-operator
  1. Install the operator that deploys the resources:
helm -n elastic upgrade -i eck-operator . --create-namespace
  1. Create a file named elastic.yaml with the following content:
apiVersion: elasticsearch.k8s.elastic.co/v1
kind: Elasticsearch
metadata:
  name: elasticsearch
  namespace: elastic
spec:
  version: 8.5.1
  nodeSets:
    - config:
        indices.fielddata.cache.size: 38%
        xpack.ml.enabled: false
        xpack.security.enabled: true
      count: 1
      name: default
      podTemplate:
        spec:
          containers:
            - name: elasticsearch
              resources:
                limits:
                  memory: 1Gi
                  cpu: '1'
                requests:
                  cpu: '1'
                  memory: 1Gi
          initContainers:
            - command:
                - sh
                - '-c'
                - sysctl -w vm.max_map_count=262144
              name: sysctl
              securityContext:
                privileged: true
                runAsUser: 0
          nodeSelector:
            kubernetes.io/os: linux
      volumeClaimTemplates:
        - metadata:
            name: elasticsearch-data
          spec:
            accessModes:
              - ReadWriteOnce
            resources:
              requests:
                storage: 128Gi
  1. Create a file named kibana.yaml with the following content:
apiVersion: kibana.k8s.elastic.co/v1
kind: Kibana
metadata:
  name: kibana
  namespace: elastic
spec:
  version: 8.5.1
  count: 1
  elasticsearchRef:
    name: elasticsearch
  podTemplate:
    spec:
      containers:
        - name: kibana
          env:
            - name: NODE_OPTIONS
              value: "--max-old-space-size=2048"
          resources:
            requests:
              memory: 512Mi
              cpu: 0.5
            limits:
              memory: 1Gi
              cpu: 1
      nodeSelector:
        kubernetes.io/os: linux
  1. Run the following command to install Elasticsearch:
kubectl -n elastic apply -f elastic.yaml
Check the deployment status:
kubectl -n elastic get statefulset
  1. Run the following command to install Kibana:
kubectl -n elastic apply -f kibana.yaml
Check the deployment status:
kubectl -n elastic get deployment
  1. Get the password for an Elasticsearch user:
kubectl -n elastic get secret elasticsearch-es-elastic-user -o go-template='{{.data.elastic | base64decode }}'
  1. Add the following parameters to your env_specific.yaml file:
logging:
  enabled: true
  elasticsearch:
    enabled: true
    host: elasticsearch-es-http.elastic.svc.cluster.local
    username: elastic
    password: elastic_user_password
    scheme: https
  1. If you are installing Kibana after the product has already been installed, update your env_specific.yaml file and run the following command:
ansible-playbook -i inventories/k8s playbooks/6-DeployMonitoring-k8s.yml

Grafana

Grafana (used together with Prometheus) is a tool for visualizing, monitoring, and analyzing data. Grafana is not installed together with ABBYY Vantage and has to be installed and set up separately. You can use any existing installation.
Grafana must be installed in the cluster since Prometheus is only available within a cluster.
The sample setup procedure below has been simplified and is provided only as an example.
To install Grafana:
  1. Create a file named grafana.yaml.
  2. Copy and paste the following code into the file and save it:
persistence:
  enabled: false
rbac:
  create: true
  namespaced: false
serviceAccount:
  create: true
podLabels:
  app.kubernetes.io/component: grafana
nodeSelector:
  kubernetes.io/os: linux
adminUser: admin
adminPassword: password
plugins:
  - grafana-piechart-panel
  - flant-statusmap-panel
grafana.ini:
  server:
    root_url: "%(protocol)s://%(domain)s:%(http_port)s/grafana/"
    enable_gzip: "true"
ingress:
  enabled: true
  annotations:
    kubernetes.io/ingress.class: abbyy-nginx
    nginx.ingress.kubernetes.io/rewrite-target: /$2
  tls:
    - secretName: platform-wildcard
      hosts:
        - {{ env }}.{{ domain }}
  hosts:
    - {{ env }}.{{ domain }}
  path: "/grafana(/|$)(.*)"
sidecar:
  dashboards:
    enabled: true
    label: grafana_dashboard
datasources:
  datasources.yaml:
    apiVersion: 1
    datasources:
      - name: Prometheus
        editable: true
        isDefault: true
        jsonData:
          timeInterval: 5s
          tlsSkipVerify: true
        type: prometheus
        url: 'http://prometheus-scaling.abbyy-monitoring.svc.cluster.local:9090'
      - editable: true
        isDefault: true
        jsonData:
          timeInterval: 5s
          tlsSkipVerify: true
        name: Victoria
        type: prometheus
        url: 'http://victoria-metrics-abbyy.abbyy-monitoring.svc.cluster.local:8428'
Replace the host parameter value with the domain name of your Vantage cluster and change the initial administrator password.
  1. Run the following commands:
helm repo add grafana https://grafana.github.io/helm-charts
helm -n abbyy-monitoring upgrade -i grafana grafana/grafana -f grafana.yaml