
Create an XEvents session
Create the session with the SQL Server Management Studio wizard, in this order:-
Launch the New Session Wizard from Object Explorer under Management → Extended Events → Sessions.
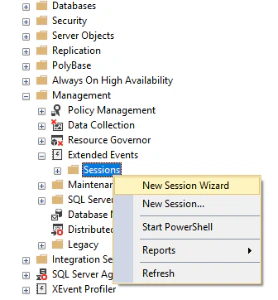
-
Specify a name for your session. To launch it on server start, select the Start the event session at server startup option.
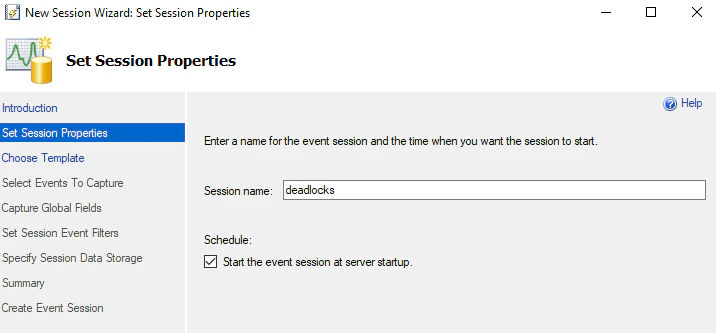
-
In the Select Events To Capture section, look for
xml_deadlock_report.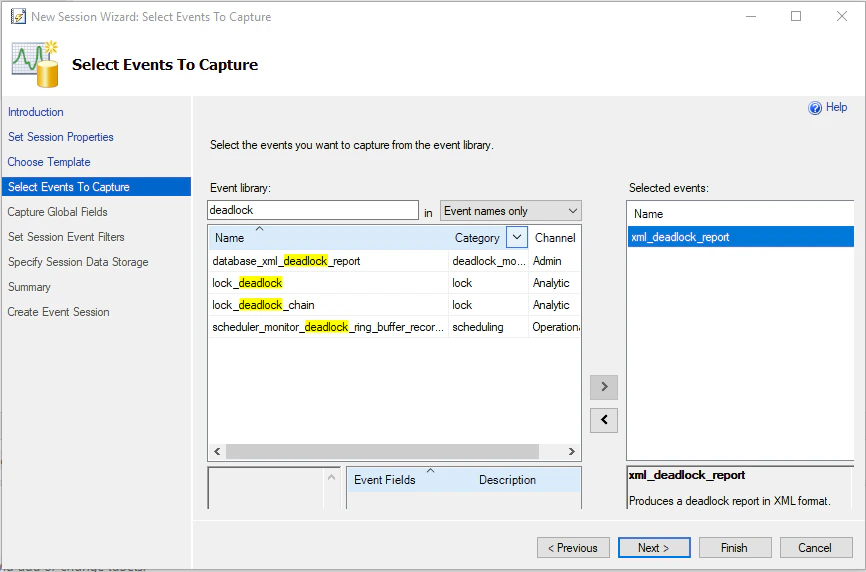
- In the Specify Session Data Storage section, specify the path to the location where the file containing the recorded session results is stored. The Enable file rollover option enables automatic rotation in the specified directory.
- In the Summary section, you can open and save the wizard session results in T-SQL.
View deadlock information
From the XEvents session
To read.xel files, SQL Server provides the sys.fn_xe_file_target_read_file table-valued function. Run the following query in SQL Server Management Studio, specifying the path to the trace files:
From the system_health session
If deadlock logging is not enabled, you can view deadlock information using thesystem_health session, which is always enabled by default. Run the following query in SQL Server Management Studio: