
The GroupSample.fsp sample project
TheGroupSample.fsp project (folder %public%\ABBYY\FlexiCapture\12.0\Samples\FLS\Tips and Tricks\Group\Project1) shows how Group elements can be used. The goal is to detect the fields with the invoice number, the invoice date, and the invoice sum on the image.
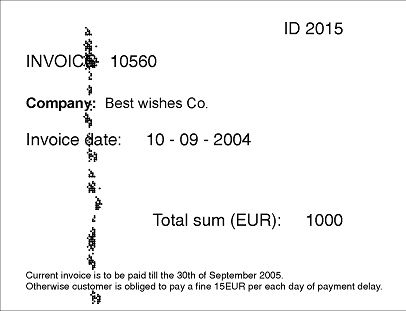
Group the invoice fields into InvoiceRequisiteGroup
As the image shows (and as is usually true for all financial documents), the number and the date of the document are neighboring fields. Even if the arrangement of the fields on another document is different, they will still be close to each other. Furthermore, they are connected by the logic of the document, as they describe certain bank details and form a logical block. To make the structure of the FlexiLayout more explicit, the project groups them into a Group element named InvoiceRequisiteGroup.Before the elements were grouped, a special identifying element was created. (Identifier elements are described in detail in FlexiLayout identification and processing in ABBYY FlexiCapture.) This element was only created to illustrate the “branching out” of the tree of hypotheses caused by the presence or absence of Group elements in it.Assume that all the elements in the tree, except the identifier element, are optional, and their null hypotheses have the default quality of 0.97.
The settings of the elements are not described here. You can look them up directly in the project.
How the group selects the best chain of hypotheses
Now try matching the FlexiLayout with the test images in the batch. After you have started the FlexiLayout matching procedure by selecting the Match command, you will see that the tree of hypotheses consists of a single chain.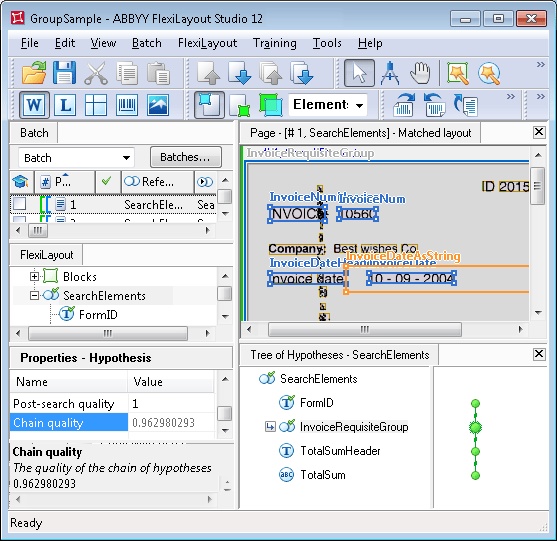
The tree of hypotheses consists of just one chain. The quality of the Group coincides with the quality of the best chain in the Group.
Post-search relations are not specified for any of the elements, so for each element Post-search quality = 1, and you can judge the quality of any given hypothesis by its Pre-search quality.
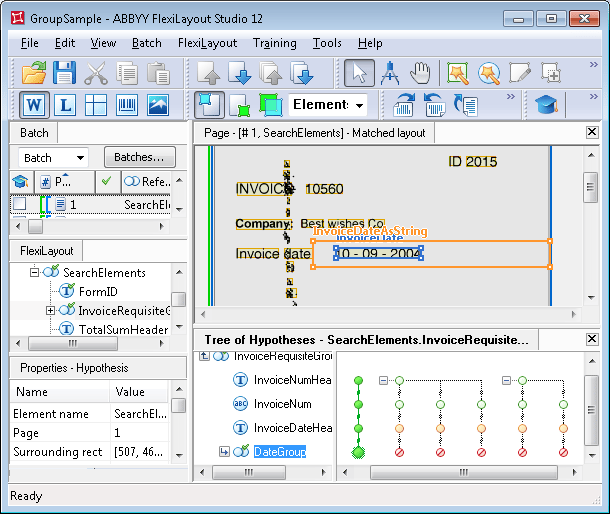
The search for the best hypothesis is done within the Group. The quality of all the chains is analyzed and compared. The quality of the Group will be determined by the quality of the best chain in the Group.
Why the correct chain wins despite lower initial quality
As noted earlier, the properties of the InvoiceDateHeader element specify that it should be sought under the line with the invoice number. However, none of the chains with the best quality (Chain quality = 1) resulted in a hypothesis for the name of the date field. Consequently, null hypotheses were formed in these chains for the InvoiceDateHeader element. Since the default quality of a null hypothesis was not changed, the resulting Chain quality of the corresponding chains dropped to 0.97. At the same time, the element corresponding to the name of the date field was found for the chain that had the lowest quality. The quality of its hypothesis is approximately 0.993. It is less than 1 because the image in the area of the name is noisy, which resulted in a recognition error and an incomplete match between the recognized text and the value specified in the properties of the InvoiceDateHeader element. As a result, the found hypothesis was penalized and its final quality is about 0.98 (the result of multiplying 0.99 by 0.993). Nevertheless, the final quality of this hypothesis is higher than that of the others (0.97), so at this stage this chain is the best. To detect the date field, the project uses the Group element DateGroup, which specifies that at least one of the elements cannot be found if the other has been found (theDontfind function was used).
Because of the document layout features and the properties specified for the InvoiceDateAsString element (its alphabet allows digits), FlexiLayout Studio managed to find the date field for all the chains, though only one of the three hypotheses is actually correct.
Since in each Group one of the elements has been found while the other has not, the final quality of the chain in each of the DateGroup groups is 0.97 (1 multiplied by 0.97, the default quality of the null hypothesis).
In this example, the final quality of the DateGroup chains will not affect the “balance” among the hypotheses at the moment of detecting the InvoiceDateHeader element, that is, the quality of each of the chains is multiplied further by 0.97.
In the end, FlexiLayout Studio generated a single hypothesis for the Group element InvoiceRequisiteGroup, which corresponds to the best chain in the Group. Its quality is approximately 0.953, that is, the “group approach” helped the right hypothesis win, even though its initial quality was lower.
The tree of hypotheses without Group elements
To see how the tree of hypotheses would look without Group elements in the FlexiLayout, open theGroupSample.fsp project in the Group\Project2 folder. The tree is shown in the following figure.
As is clear from the figure, after detecting the FormID element, the tree of hypotheses branched out because several hypotheses are generated for the InvoiceNumHeader element. As a result, FlexiLayout Studio has to compare the qualities of each of the chains, starting every time from its very first element and moving down to the last.
Moreover, for any document with a layout more complex than the one in this example, a FlexiLayout without Group elements will produce a tree of hypotheses with too many branches, which will make FlexiLayout matching more difficult.
Avoid placing all the sought elements into one root group. This is only suitable for very simple FlexiLayouts with fewer than 10 elements, which is very rare in real-life tasks.An increase in the number of elements in the root Group causes massive growth of the number of hypotheses, until it reaches its limit of 10,000 or the memory allocated for the tree of hypotheses is all used up. In either case, matching the FlexiLayout may fail.
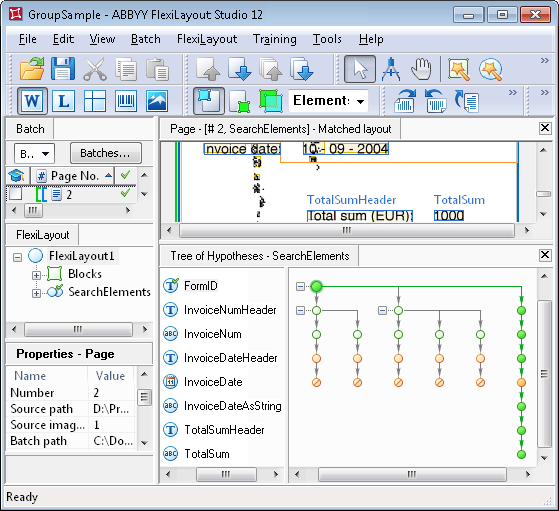
An ungrouped tree of hypotheses has too many branches and its visual analysis is difficult.