
- Select Classification Training → View Statistics in the main menu.
- Click the Statistics button on the toolbar.
Classification parameters
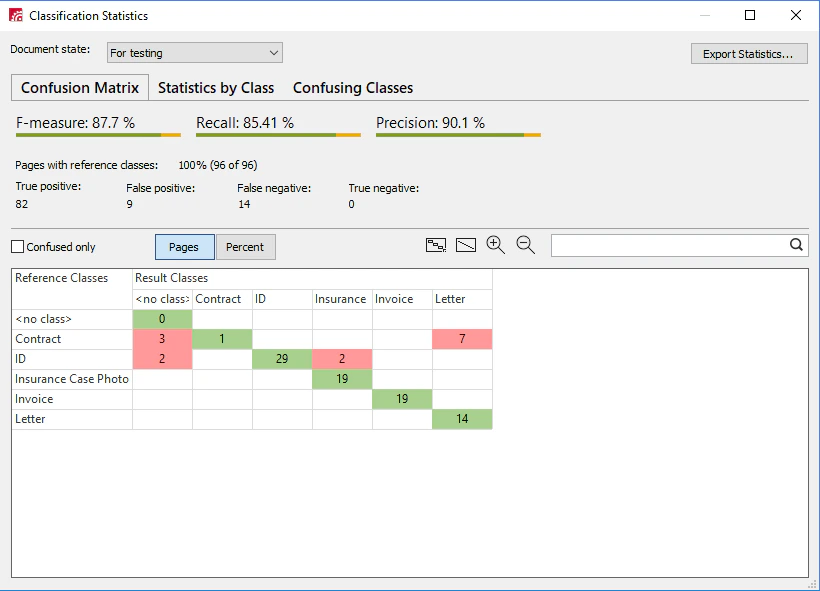
The window shows the F-measure, Recall, and Precision. The higher these values, the more precise the classification. For more information, see Glossary: Classifier F-measure. The window also shows the number of pages with reference classes and the page classification results:
Use the drop-down list in the top-left corner to show statistics for For Testing pages, For Training pages, or both.
Ways to view the results
FlexiCapture presents the ratio of reference classes to result classes, and the training results, in three ways.Confusion Matrix
The confusion matrix visualizes the documents a classifier most often confuses. Each cell holds the ratio of a reference class to a result class. Green cells show pages classified correctly. Red cells show confused classes, which are classes the classifier assigned incorrectly to pages that have a reference class. Tools for working with the confusion matrix:- Confused only – Hides classes whose result class matched the reference class for every page.
- Pages and Percent – Switch between page counts and percentages. The percentage is pages with a correctly assigned class relative to all pages with the same reference class.
- Fixed scale – Displays the matrix at a fixed scale.
- Whole matrix – Displays the entire matrix.
- Zoom in and Zoom out – Adjust the matrix scale.
Statistics by Class
A table of statistics for pages whose result class did not match the reference class. Use it to find the classes that cause the most errors. You can sort by the number of confused pages, or by the ratio of confused pages to the total pages of that reference class.Confusing Classes
A list of all classes the classifier assigned incorrectly. Use it to determine which classes are most often confused with each other. Double-click a matrix cell or a data-table row to open the pages for the selected classes. A reference-and-result-class search row is available on all tabs, and you can sort any data table to find the most problematic classes.Export the statistics
To export the statistics, click Export Statistics in the Classification Statistics dialog box. Specify a name and location, choose CSV or TXT, and select which statistics to export:- Summary statistics for the major parameters: F-measure, Recall, Precision, and classification results by page.
- Major parameters broken down by class.
- Confusing classes: the number and percentage of pages for each confusing class.
- All classes: the number and percentage of pages for each class.
Re-initialize classifier training after any of the following changes:
- Added or removed documents in the For Training state.
- Assigned or removed the For Training state on a document.
- Added, deleted, or merged classes.
- Assigned a different reference class to a document.
- Changed the classification profile or the precision/recall priority.